
Building Pathways
for Adoption
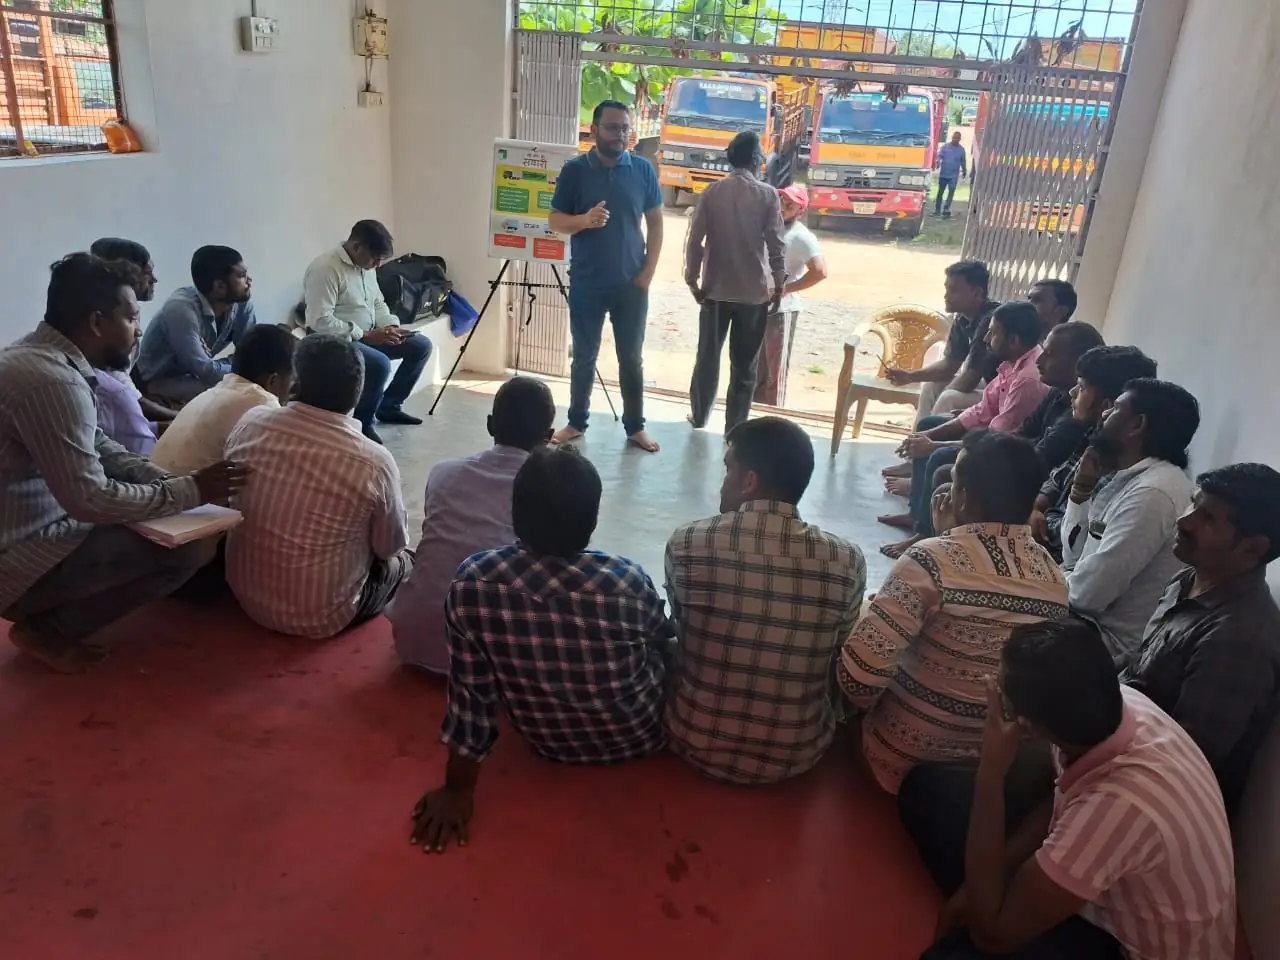
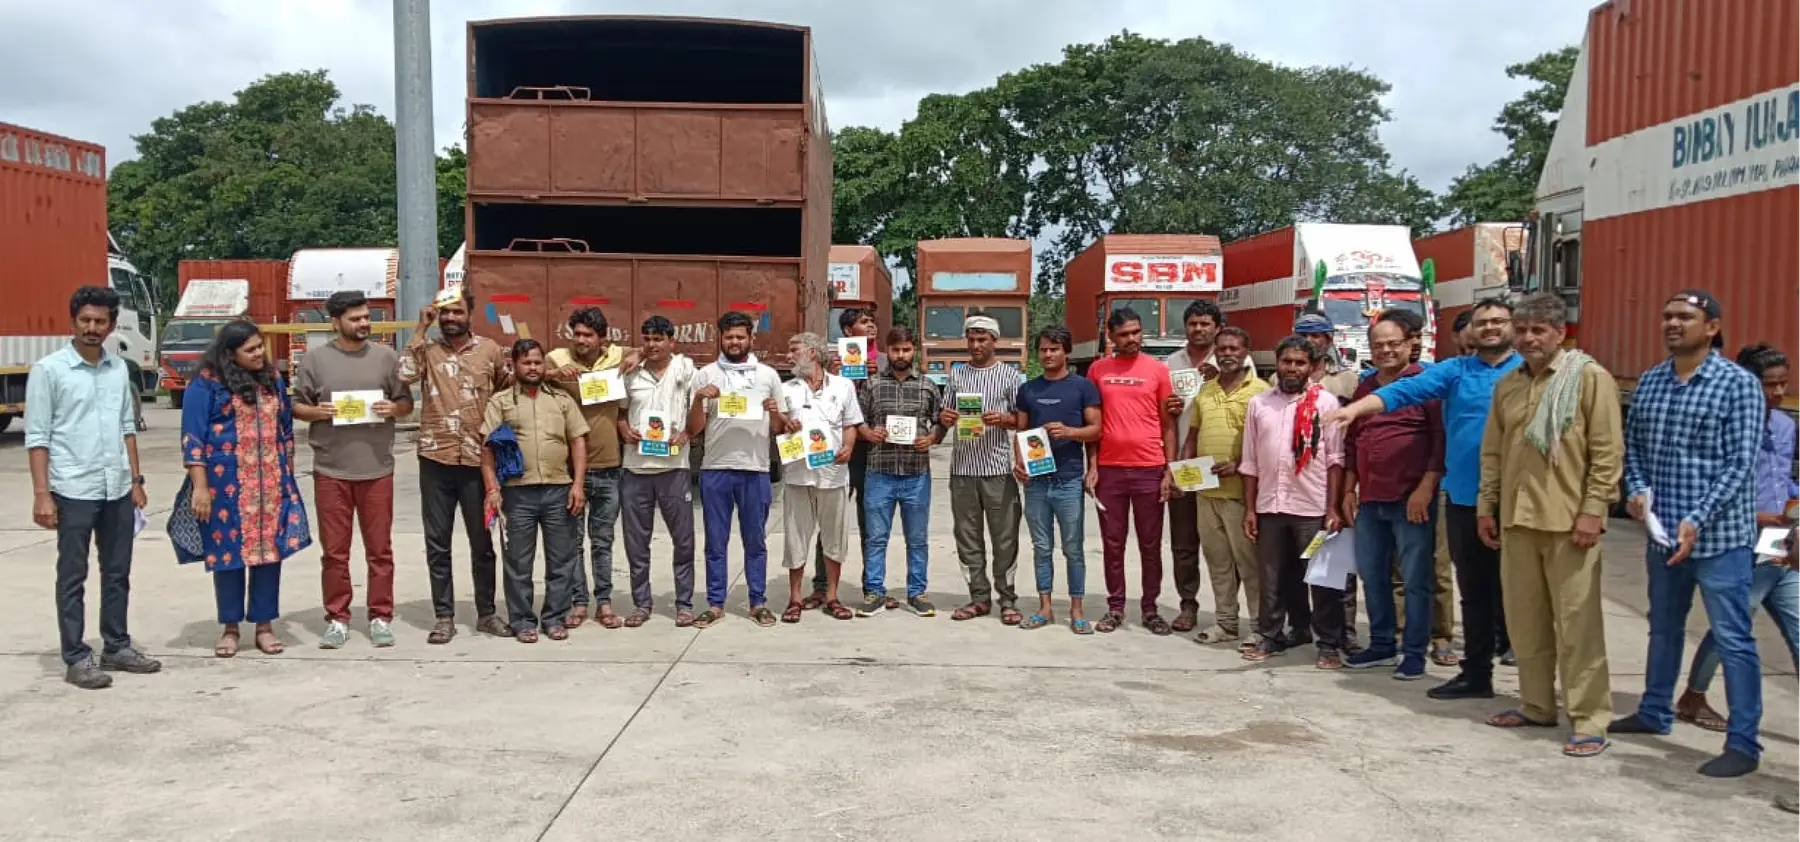
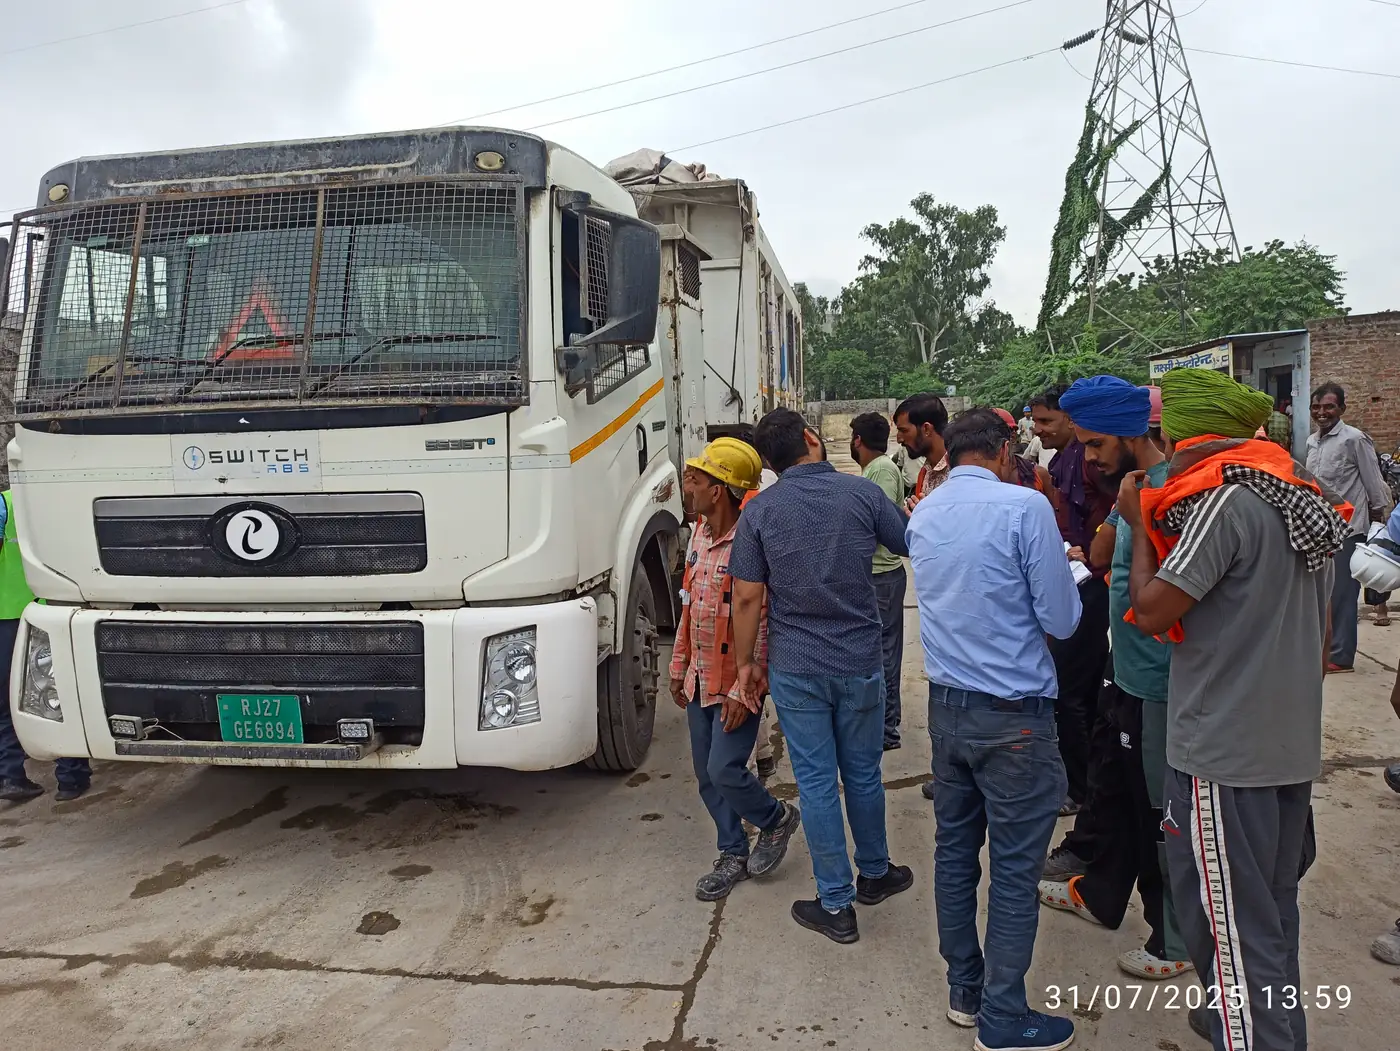
By introducing electric trucks to 57% of stakeholders for the first time, Nayi Soch Ki Sawaari addressed a critical awareness gap, transitioning end-users from limited exposure to informed engagement.
Methodology
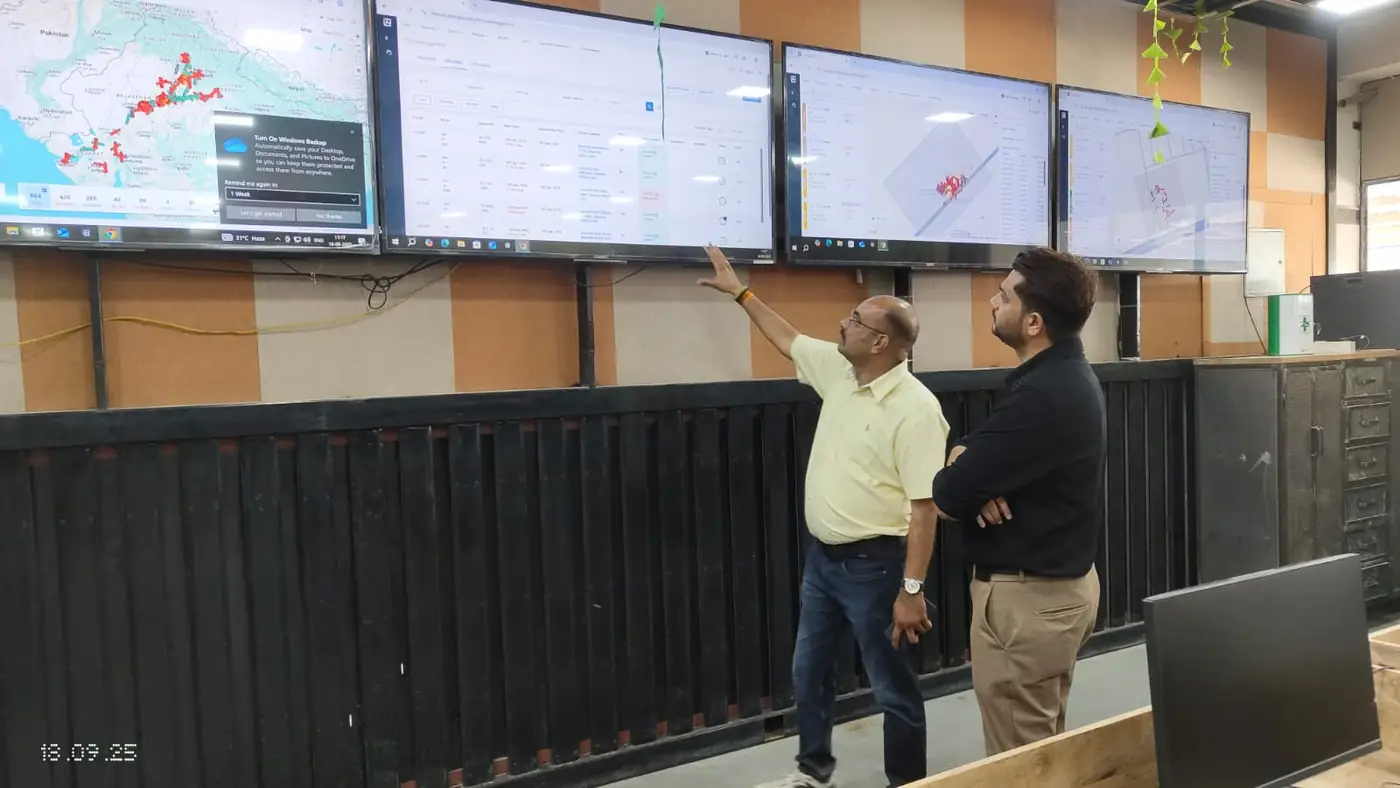
Out of 7,000+ stakeholders engaged, over 2,000 participated in perception surveys conducted after awareness sessions. In locations with electric truck demonstrations, a pre–post survey approach captured baseline perceptions and shifts after live demonstrations. These tools acted as ongoing feedback mechanisms, helping refine messaging, formats, and on-ground strategy in real time. At the same time, the consistent application of these tools over two years has helped build a deeper, evidence-based understanding of stakeholder behaviour, perception shifts, and adoption readiness over time.
Geographical Footprint
Nayi Soch Ki Sawaari across India
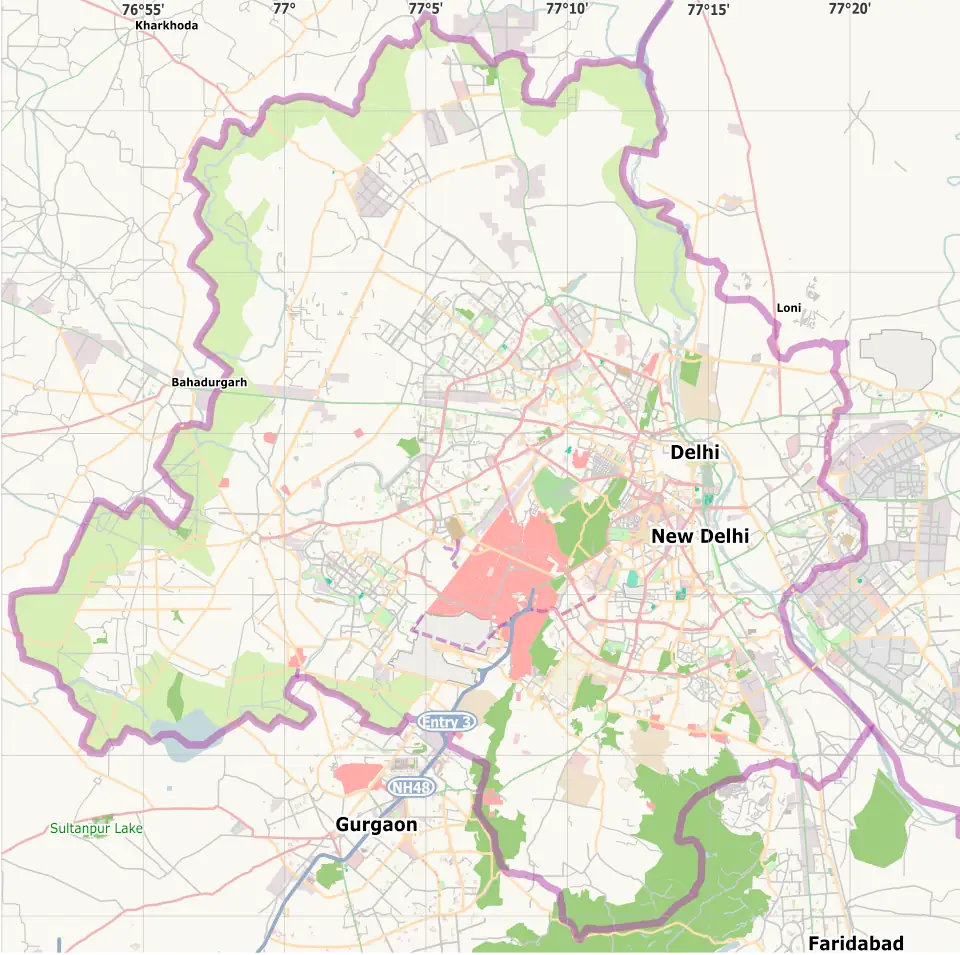
The project covered 21 states and Union Territories, representing 91% of India's heavy-duty vehicle market, providing a strong national lens on the transition. While aggregate findings highlight overall awareness and readiness, state-level realities vary significantly based on freight patterns, infrastructure, and stakeholder profiles. The following section presents state-wise insights, capturing these contextual differences shaping adoption.

User Insights
Our Stakeholders
Nayi Soch Ki Sawaari engaged key end-users across the trucking ecosystem. Drivers, mechanics, and fleet operators are directly impacted by the transition and play a role in enabling adoption.
As a close-knit community, perceptions travel across stakeholders, making it important to understand their distinct but interconnected concerns. Below are the key stakeholder insights
Fleet Operators Indicate Growing Confidence in Electric Trucks as a Viable and Sustainable Alternative.
Where did they learn about Electric Trucks?
At this session
57.8%Friends / known people
14.6%Social media / news
14.1%YouTube
7.3%Newspaper / news
3%WhatsApp
3%At this session
57.8%Friends / known people
14.6%Social media / news
14.1%YouTube
7.3%Newspaper / news
3%WhatsApp
3%
Positive Perceptions

76%
Believe e-trucks are a feasible alternative to current trucks
70%
Think e-trucks offer comparable or superior power and torque
84%
Seamless charging infrastructure would increase interest
Adoption Timeline
79%
Agree that electric trucks can help reduce air pollution

29%
Ready as soon as widely available
33%
Within the next 5 years
29%
Need more technical knowledge
Technical Factors
Spare Parts Availability
Safety Standards
Charging Infrastructure
Repair and servicing
Technology Performance
Indian E-Truck Options
Financial Factors
Warranty Coverage
Government Subsidy
Purchase Price
Maintenance Cost
Operational Cost
Purchase Tax Rebate
Resale Value
Primary Source of Information
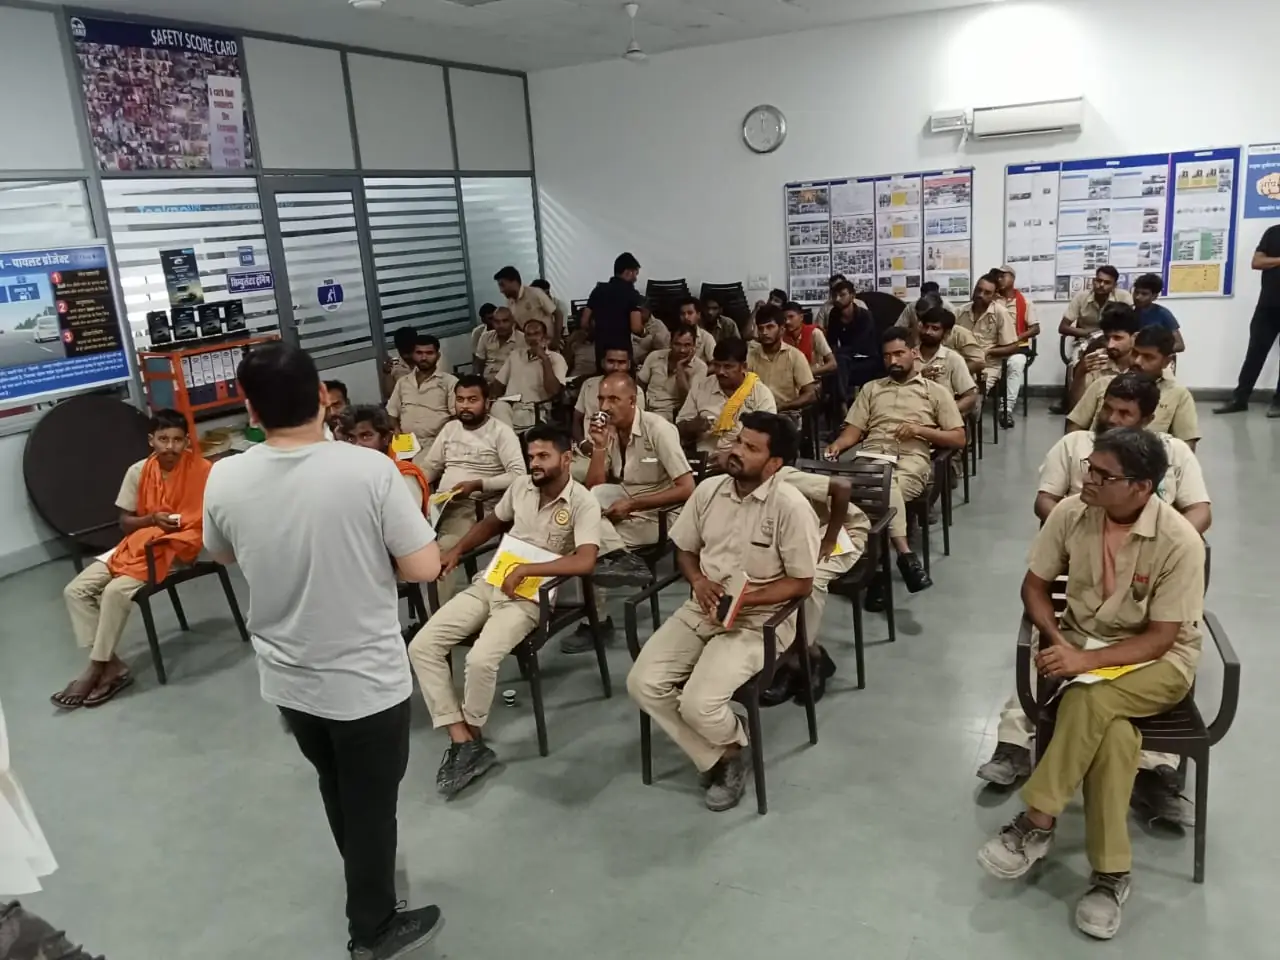
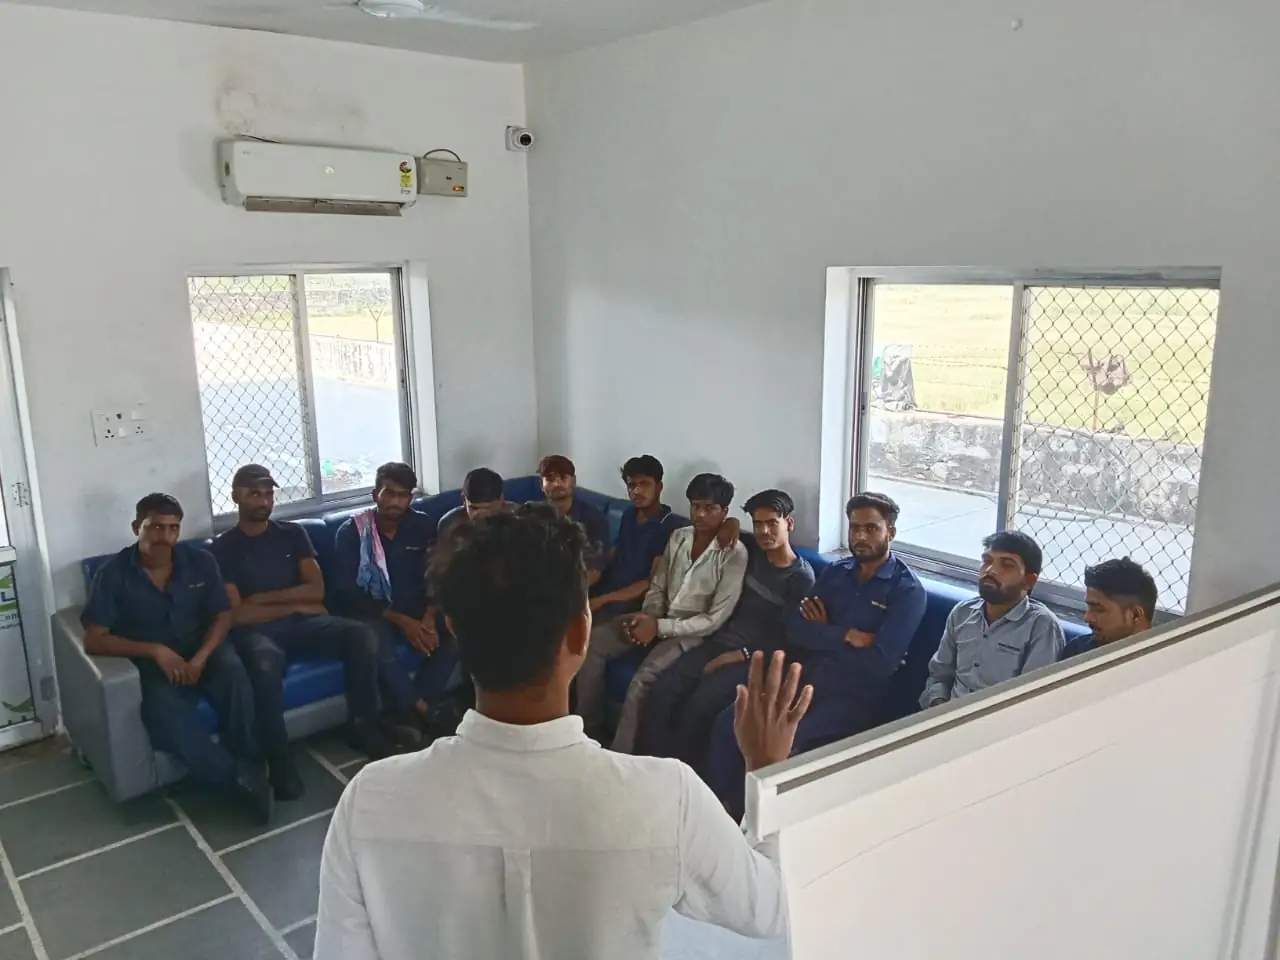
Nearly 58% of drivers first learned about electric trucks at this session, establishing on-ground engagement as the most effective awareness channel. Friends and social media (14.6% and 14.1%) are the next most common sources, while digital platforms like YouTube (7.3%) play a smaller supporting role. Traditional channels remain limited in reach, indicating room to strengthen organic information flow within the ecosystem. This highlights a clear opportunity to scale structured, in-person engagements while strengthening digital amplification. Building trusted peer-led and community-driven communication channels can further accelerate awareness and adoption.
At this session
57.8%Friends / known people
14.6%Social media / news
14.1%YouTube
7.3%Newspaper / news
3%WhatsApp
3%At this session
57.8%
Friends / known people
14.6%
Social media / news
14.1%
YouTube
7.3%
Newspaper / news
3%
WhatsApp
3%
Impact of Demonstrating an Electric Truck
The difference in perception change between sessions with and without a physical electric truck demonstration clearly shows why live demos are essential. In some metrics, sessions without demos showed weaker or even negative myth-busting on some metrics, indicating that awareness alone is not enough to build confidence without tangible, first-hand exposure.
Awareness
"Electric trucks require special chargers designed for heavy vehicles"
Drivers who knew this:
39%
→
86%
An 8.6× improvement. Fleet operators also showed better understanding. Awareness alone barely moved the needle without hands-on exposure.
"Electric trucks cannot be used in hilly regions"
Drivers
Almost half used to think this, but after the test, hardly anyone did. (40% down to 9%)
Fleet Owners
Over a third were worried at first, but that worry almost completely disappeared. (34.7% down to 2%)
The e-truck demonstration helped dispel assumptions rooted in past experiences with diesel and CNG vehicles.
"Electric trucks are only for large fleet companies"
Drivers
A massive shift happened here. Belief jumped from less than half to a strong majority, meaning many more drivers now see electric trucks as a real option for smaller owners and independent drivers. (48% up to 67%)
Seeing and engaging with the vehicle helped participants visualize its use for smaller operators and independent drivers, a shift in openness.
"Electric trucks are slower than diesel trucks"
Fleet Owners
This concern was completely wiped out, dropping from nearly a third of owners to almost none. (29% down to 1%)
Technical explanations around torque, acceleration, and vehicle performance, combined with examples from pilots of electric trucks across India, helped validate the capability of electric trucks among fleet operators and improved trust in the technology's real-world applicability.
"One can get electrocuted by touching an electric truck"
Drivers
Fear of electric shocks was already very low, but it dropped even further to just a tiny handful of people. (6% down to 2%)
Although reported by a relatively small share of participants, concerns around electrocution continue to persist especially during rains or accidents. While not entirely unfounded, they highlight the need for greater awareness around vehicle safety systems and emergency protocols when handling electric trucks.
Confidence
"Electric trucks can perform the same duties as diesel or petrol models"
Drivers Who Felt Confident
69%
→
97%
Uncertain Responses
21%
→
1%
Undecided responses nearly vanished, live exposure replaced uncertainty with direct conviction.
Myths & Misconceptions
In the absence of credible, accessible information, stakeholders tend to draw inferences from adjacent technologies and connect partial knowledge to unrelated assumptions, leading to the formation of misconceptions. These misconceptions declined sharply after direct engagement.
"Electric trucks cannot be used in hilly regions"
Drivers
Almost half used to think this, but after the test, hardly anyone did. (40% down to 9%)
Fleet Owners
Over a third were worried at first, but that worry almost completely disappeared. (34.7% down to 2%)
The e-truck demonstration helped dispel assumptions rooted in past experiences with diesel and CNG vehicles.
"Electric trucks are only for large fleet companies"
Drivers
A massive shift happened here. Belief jumped from less than half to a strong majority, meaning many more drivers now see electric trucks as a real option for smaller owners and independent drivers. (48% up to 67%)
Seeing and engaging with the vehicle helped participants visualize its use for smaller operators and independent drivers, a shift in openness.
"Electric trucks are slower than diesel trucks"
Fleet Owners
This concern was completely wiped out, dropping from nearly a third of owners to almost none. (29% down to 1%)
Technical explanations around torque, acceleration, and vehicle performance, combined with examples from pilots of electric trucks across India, helped validate the capability of electric trucks among fleet operators and improved trust in the technology's real-world applicability.
"One can get electrocuted by touching an electric truck"
Drivers
Fear of electric shocks was already very low, but it dropped even further to just a tiny handful of people. (6% down to 2%)
Although reported by a relatively small share of participants, concerns around electrocution continue to persist especially during rains or accidents. While not entirely unfounded, they highlight the need for greater awareness around vehicle safety systems and emergency protocols when handling electric trucks.
What needs to happen next
Key Recommendations
Financial and Policy Architecture
- Resale value guarantee mechanisms and battery lifecycle clarity
- Transparent Total Cost of Ownership (TCO) models
- Freight-type differentiated government incentives
- Concessional finance and risk guarantee funds for small fleet operators
- Toll exemptions and green corridor benefits for electric freight
Visibility of National ZET Vision
- Enhanced communication of national ZET roadmaps and mandates to end-users
- Clear articulation of supply-side mandates and demand-side incentives
- Direct outreach on policy updates to fleet operators
- Periodic consultations and feedback loops to ensure policy reflects ground realities
Charging Infrastructure as the Primary Lever
- Use-case-based deployment aligned to freight typologies (urban logistics, mining, long-haul corridors)
- Rest-stop charging models – reframe charging time as productive downtime
- Transparent tariff structures to address fears of cost escalation similar to CNG
- Decentralised renewable energy charging hubs for unreliable grid regions
Service and OEM Ecosystem Readiness
- Cross-industry alignment on safety standards and communication
- Decentralised spare parts availability to reduce dependence on OEM centres
- Warranty clarity and charging compatibility transparency
- Fleet pilot programmes linked to specific freight use cases